River network analysis use case
Welcome to the "River use case" page. Here is information on how you can use the plugin to analyze the Ob river network and which visualizations can prepare.
Important tip!
Before starting to use the algorithm, please make sure that the project uses metric projection. Also the layers used in the calculation (both linear and point layers) should be converted to this projection.
Experiment setup
- QGIS Desktop 3.34.3
- Windows
- Date: 04.02.2024
- Data: The Ob river as vector layer - see Ob_river layer in the repository
Load vector data and assign projection WGS 84 / UTM zone 40N:
- Project:
Project-Properties-CRS-WGS 84 / UTM zone 40N; - Layer:
Processing-Toolbox-Reproject layer- assign "WGS 84 / UTM zone 40N"
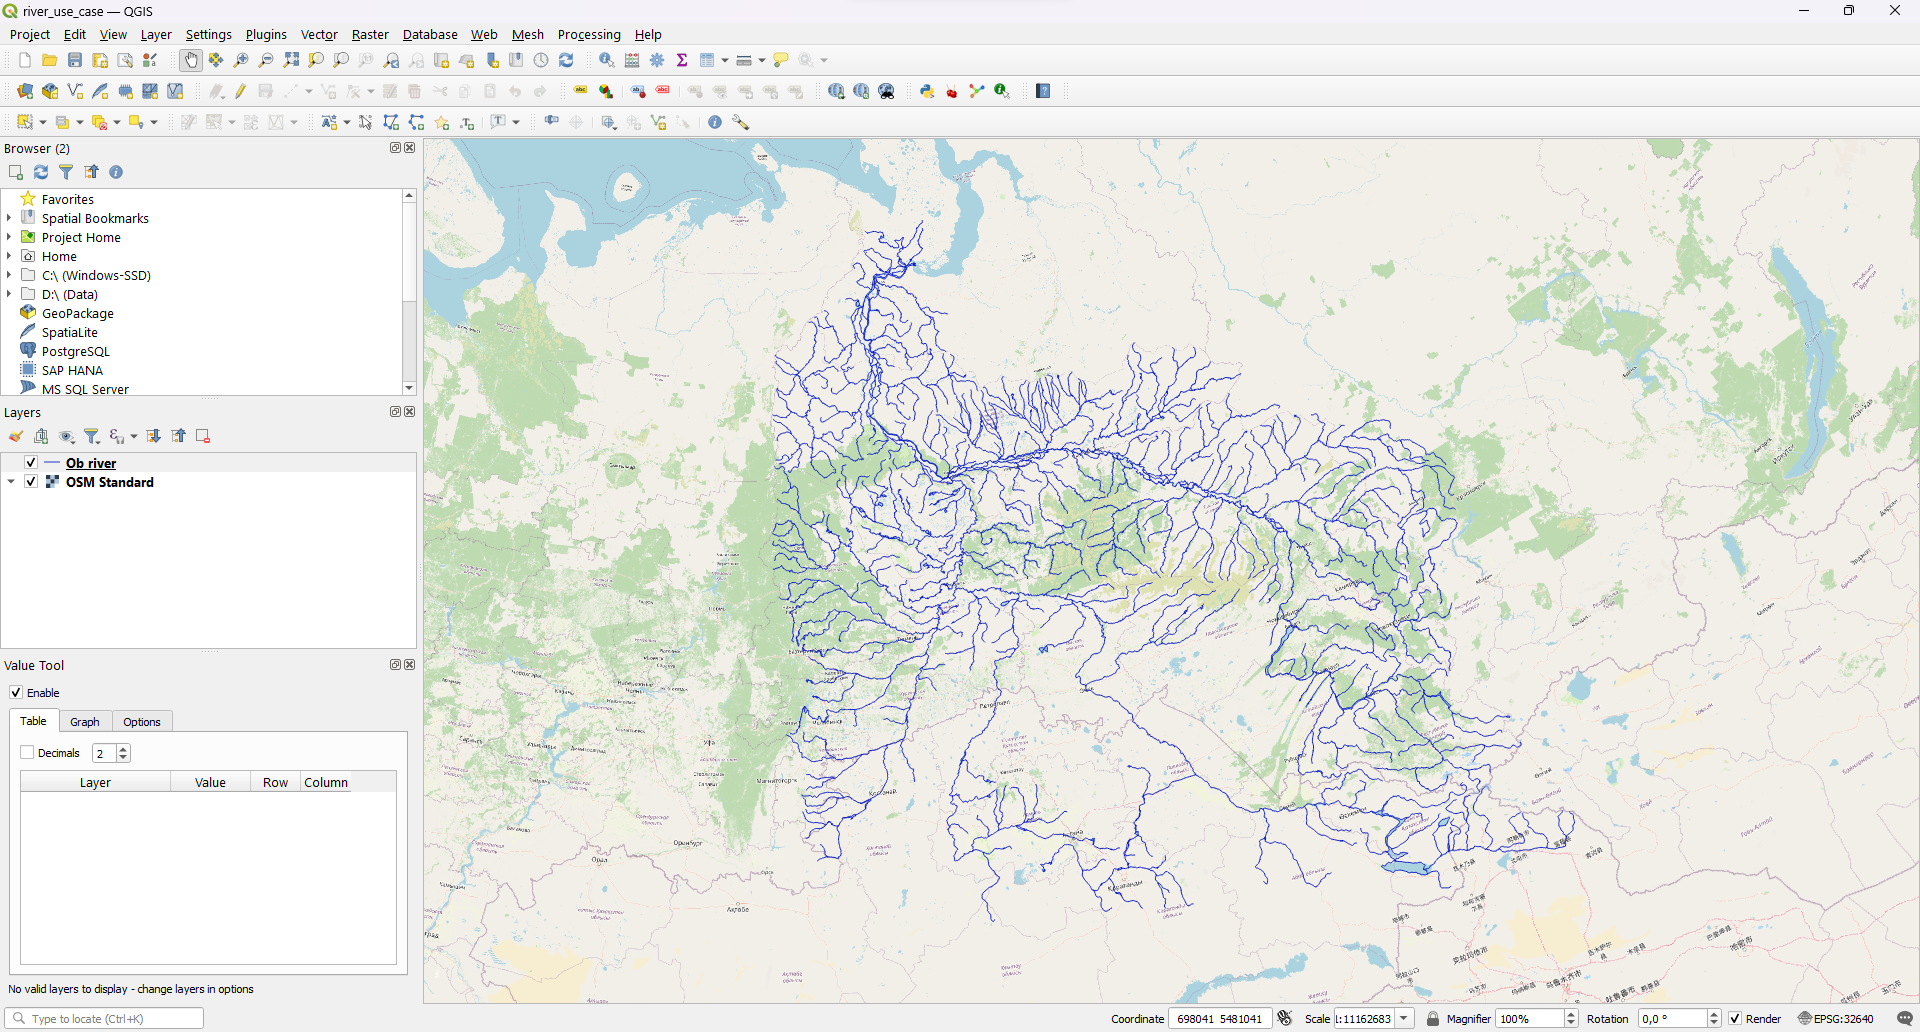
turn on Open Street Map: Web - QuickWebServices - OSM - OSM Standard. And obtain the following initial picture:
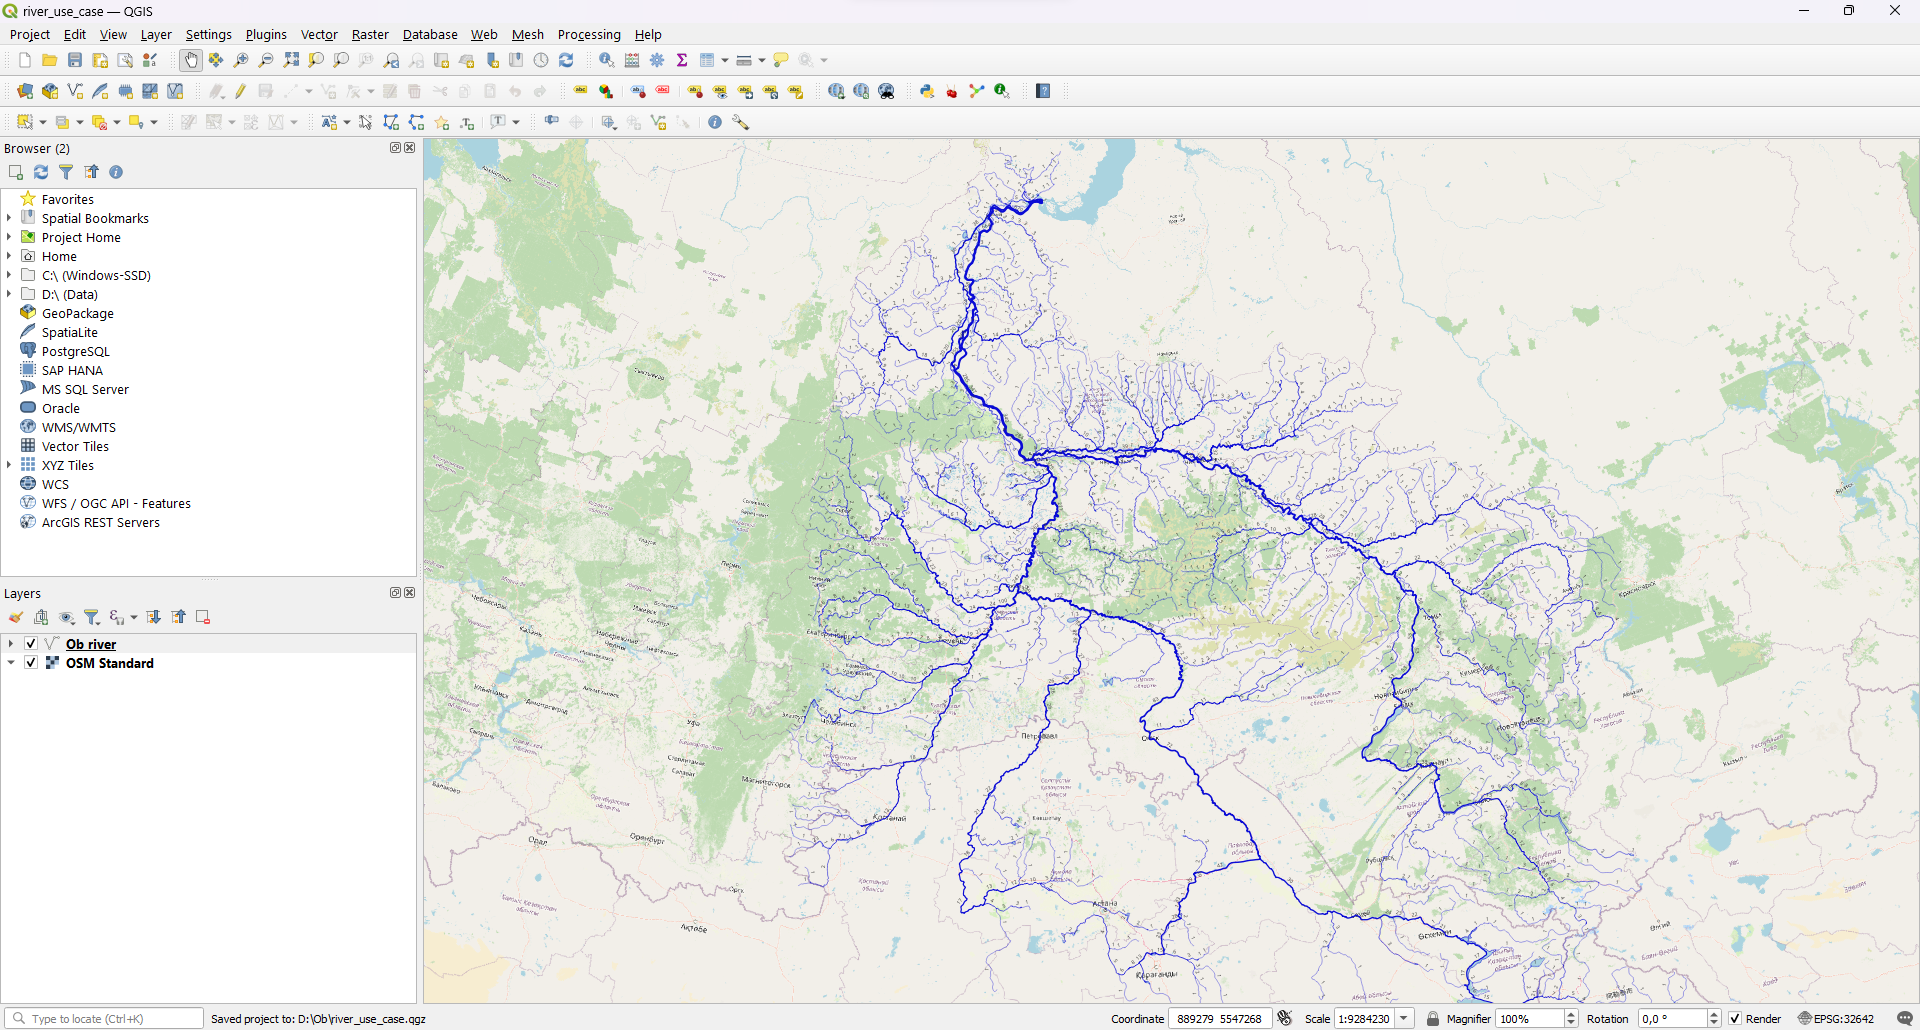
Choose start point (Gulf of Ob) and launch the algorithm - Shreve value are shown via line size:
The algorithm will assign four parameters to each river segment: ValueShreve, ValueStrahler, Rank, Distance
After that, visualizations can be prepared via rank_attributes - Properties - Symbology - Graduated.
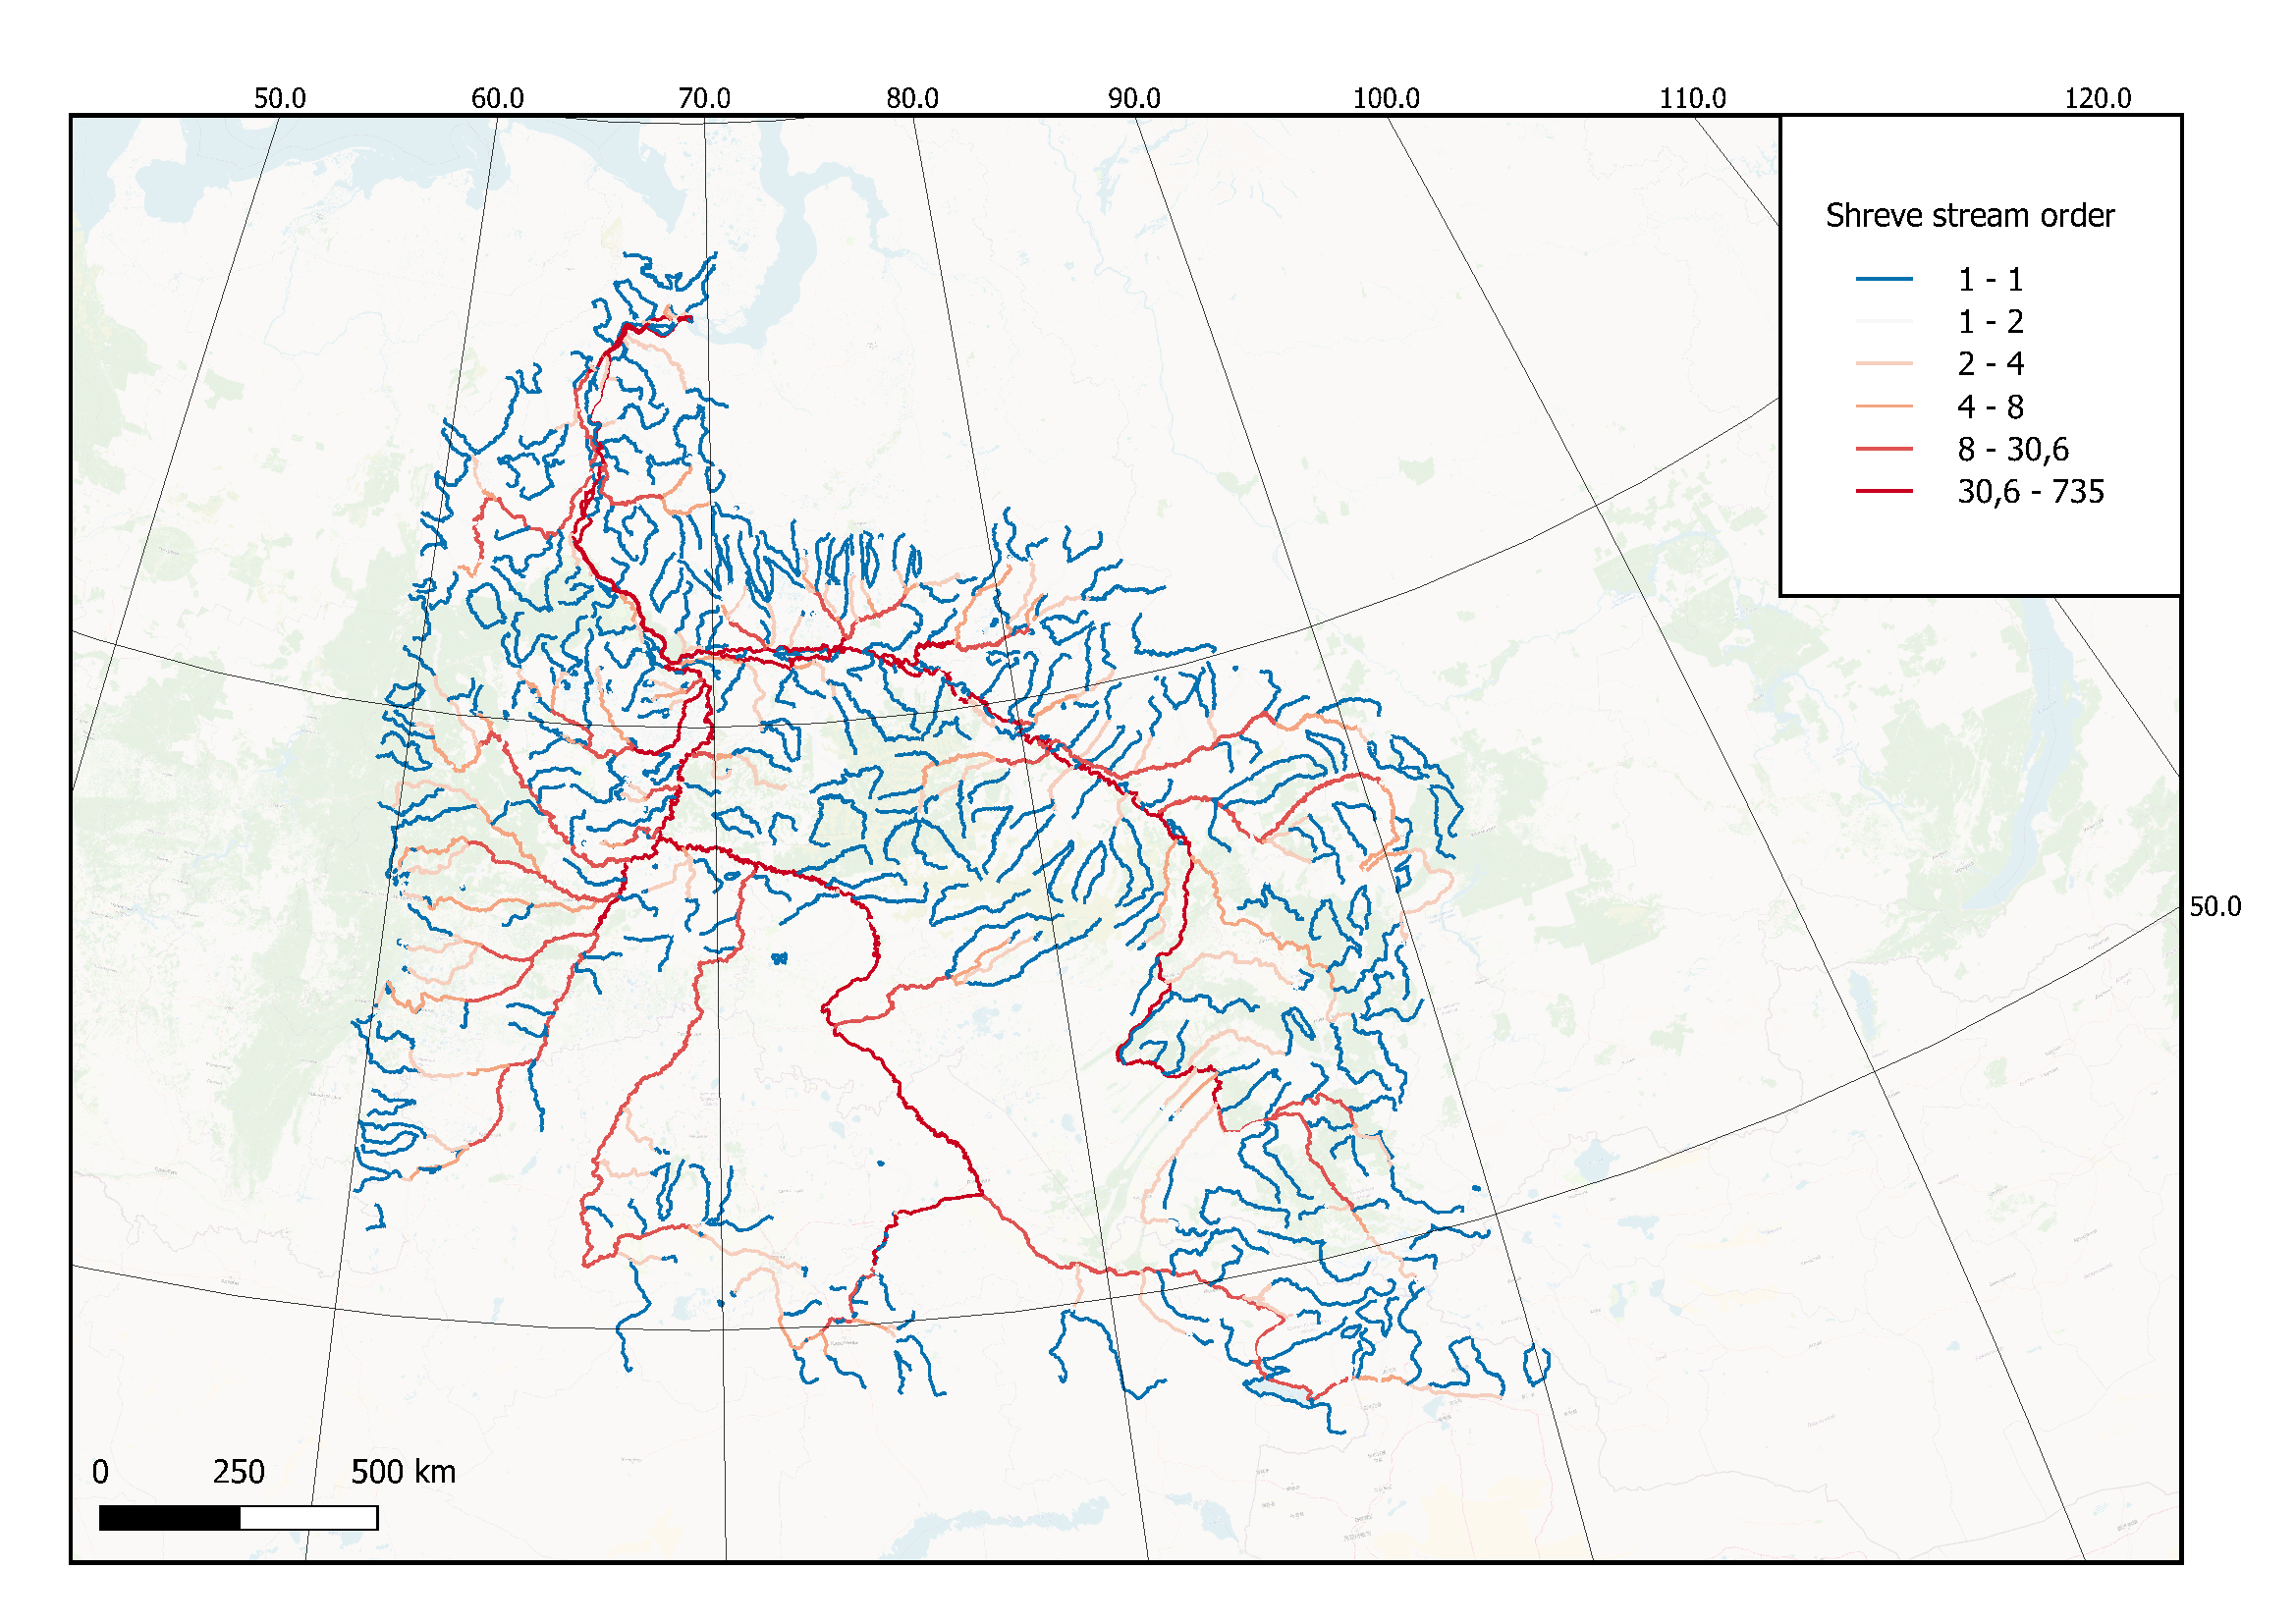
Shreve stream order
Visualize "ValueShreve" column and prepare a map
Strahler stream order
Visualize "ValueStrahler" column and prepare a map

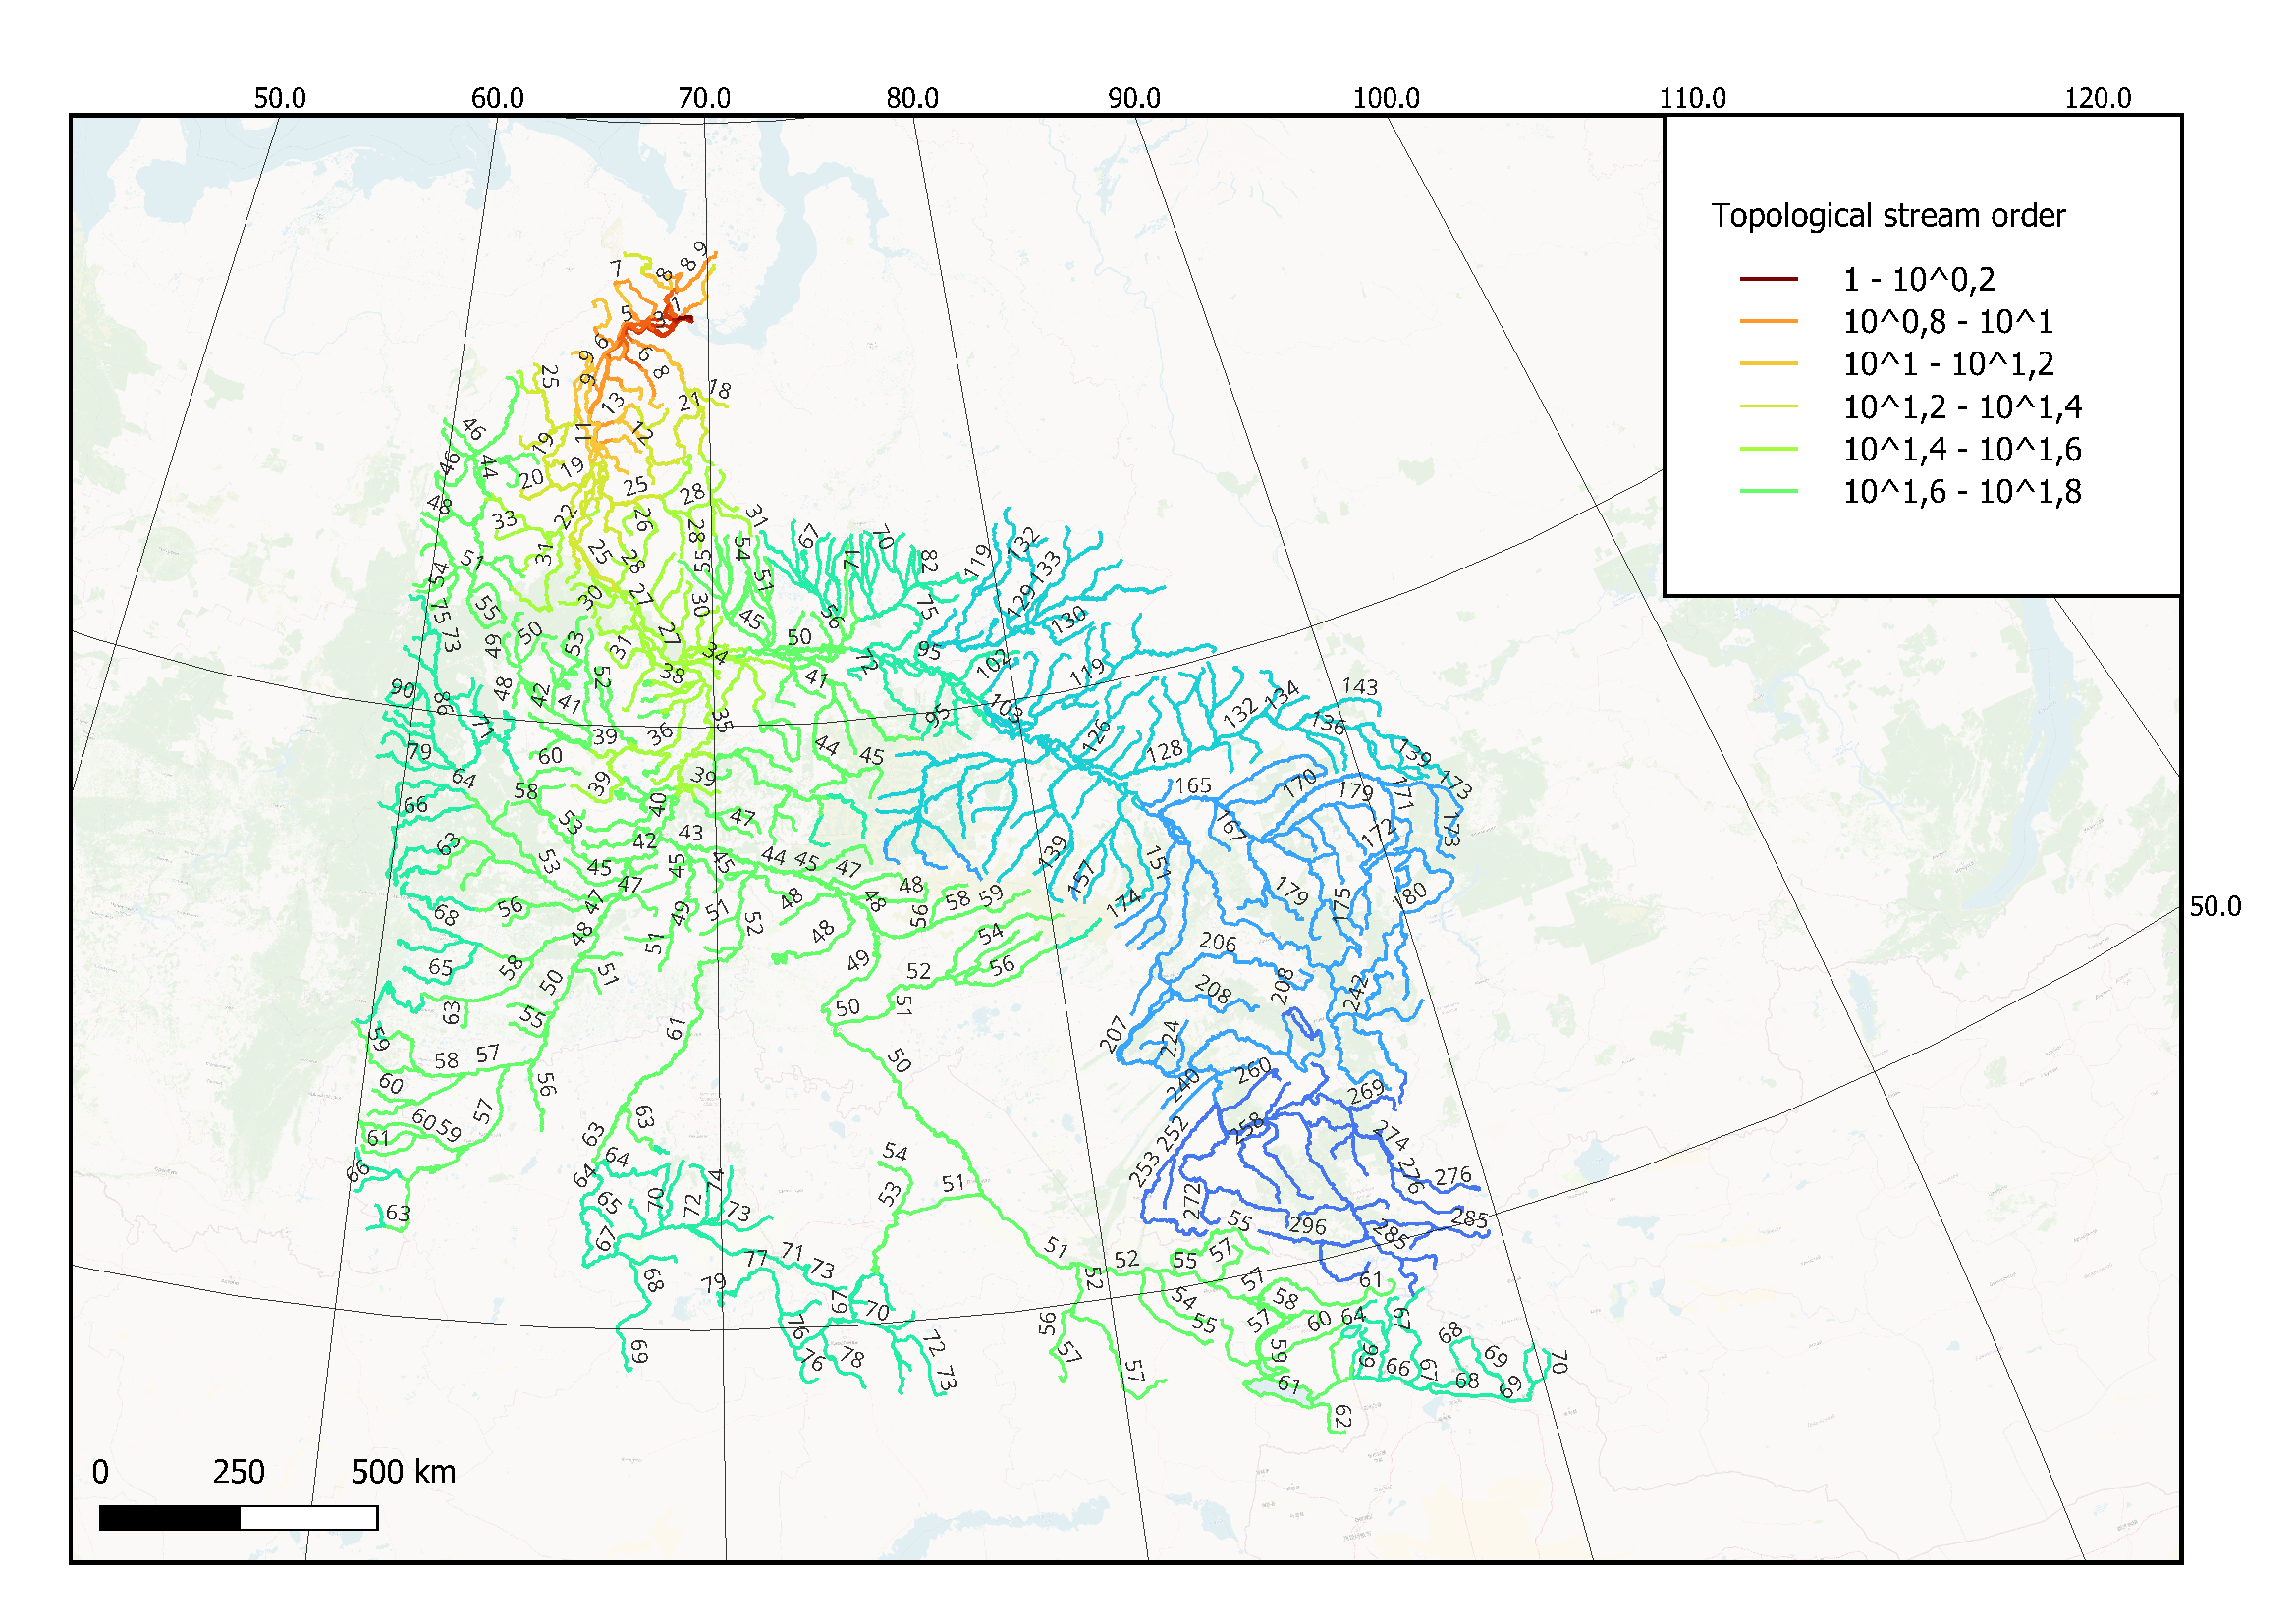
Topological stream order
Visualize "Rank" column and prepare a map