Functionality review
So, we have already installed the plugin in QGIS. It's the time to look at its functionality. In this document, we'll take a step-by-step look at how it can be used.
Important tip!
Before starting to use the algorithm, please make sure that the project uses metric projection. Also the layers used in the calculation (both linear and point layers) should be converted to this projection.
Data
In the repository with source code there is a folder with data examples (you can download this files to your computer by clicking "Download raw file"). We will take 'river_example' vector layer from example_data folder.
Load this file into QGIS (and turn on Open Street Map: Web - QuickWebServices - OSM - OSM Standard).
Perform re-projection to WGS 84 / UTM zone 49N:
- Project:
Project-Properties-CRS-WGS 84 / UTM zone 49N; - Layer:
Processing-Toolbox-Reproject layer- assign "WGS 84 / UTM zone 49N". Save result into fileriver_example_reprojected.shp(you can choose output options in re-projection tool)
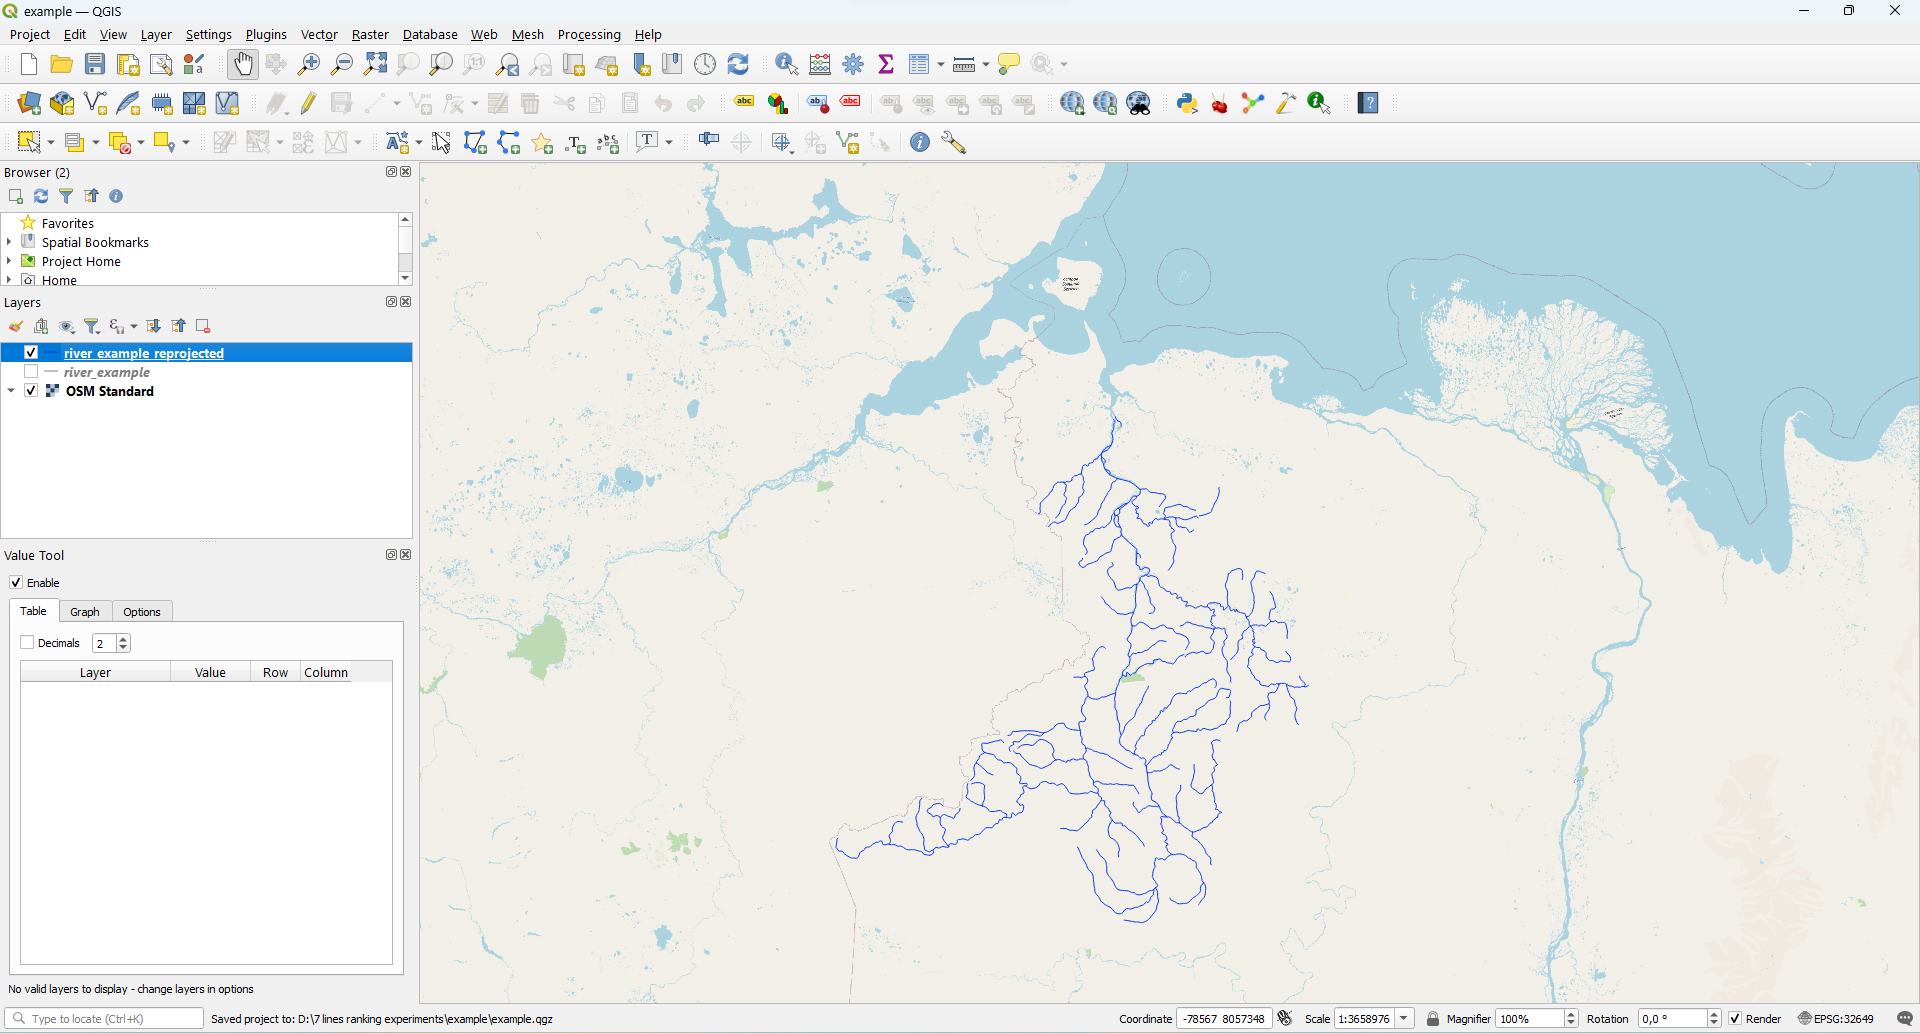
Usage example (Point on a map)
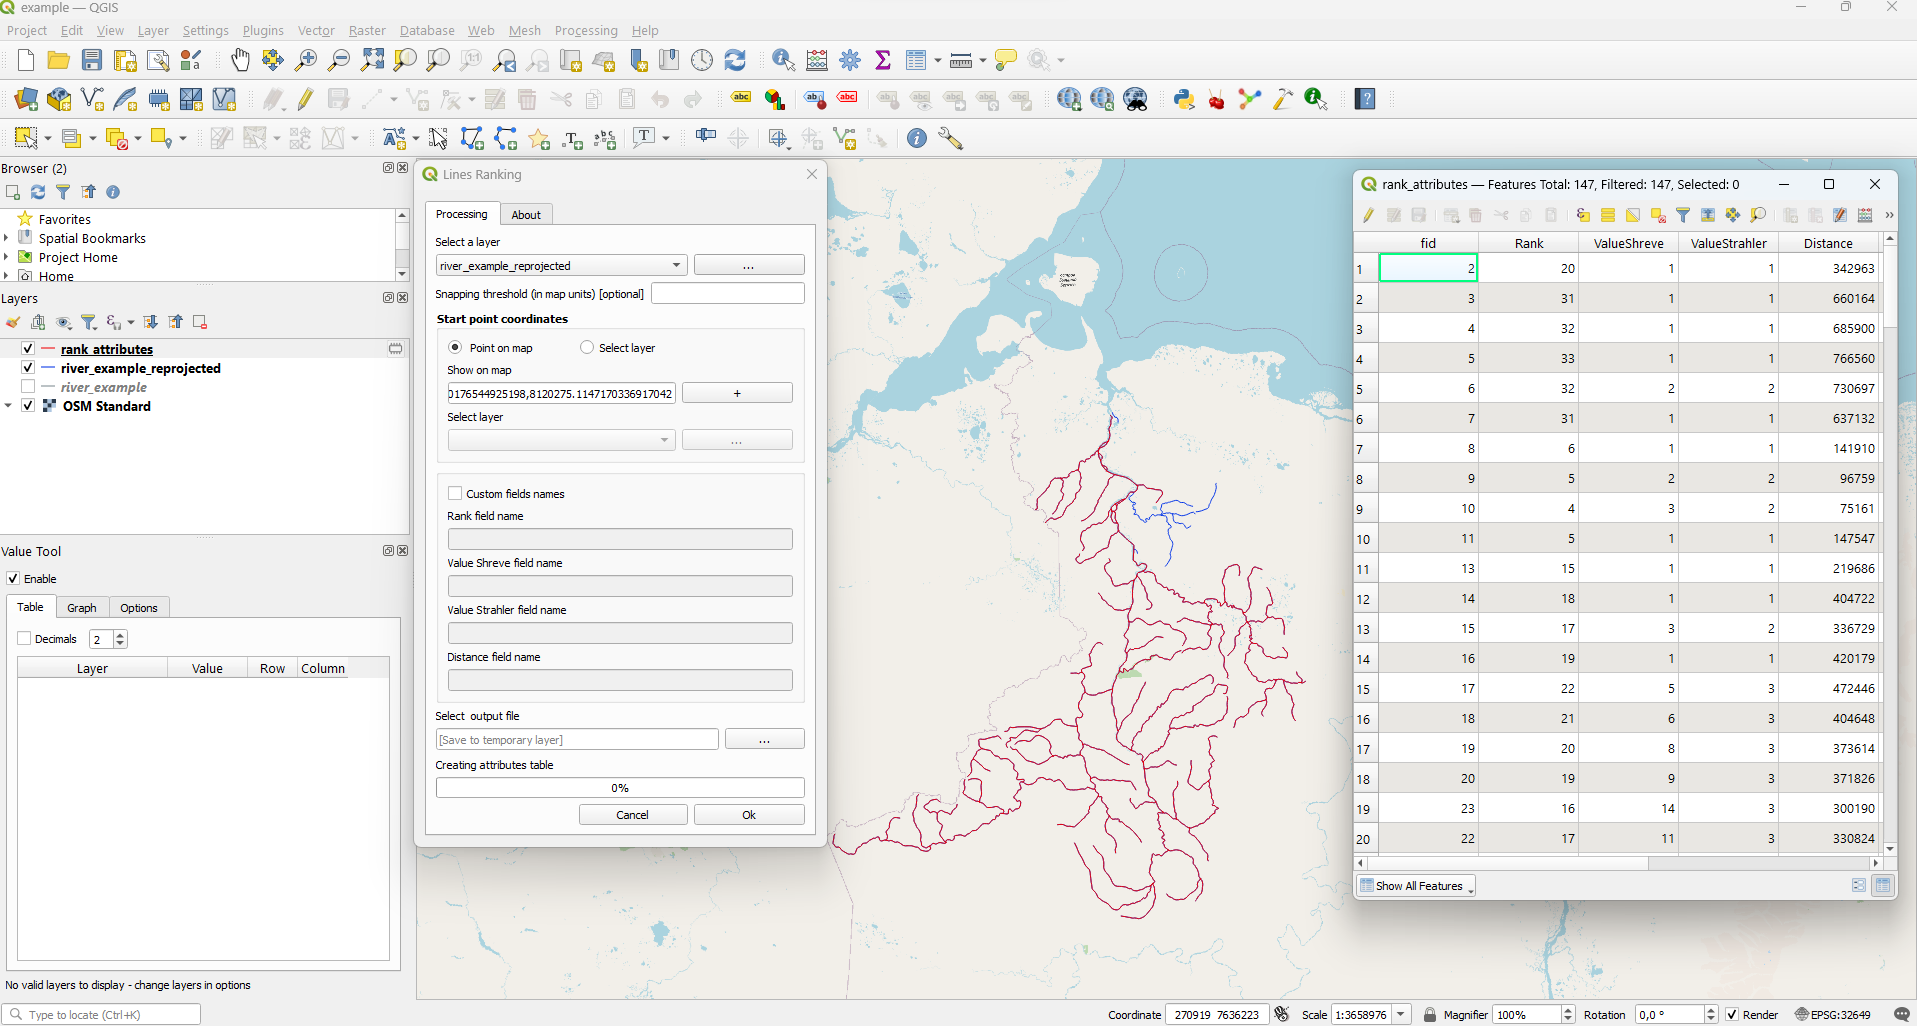
Open Lines Ranking plugin and choose option Point on a map - then just click to the place
where the river flows into the ocean. Then the following results obtained:
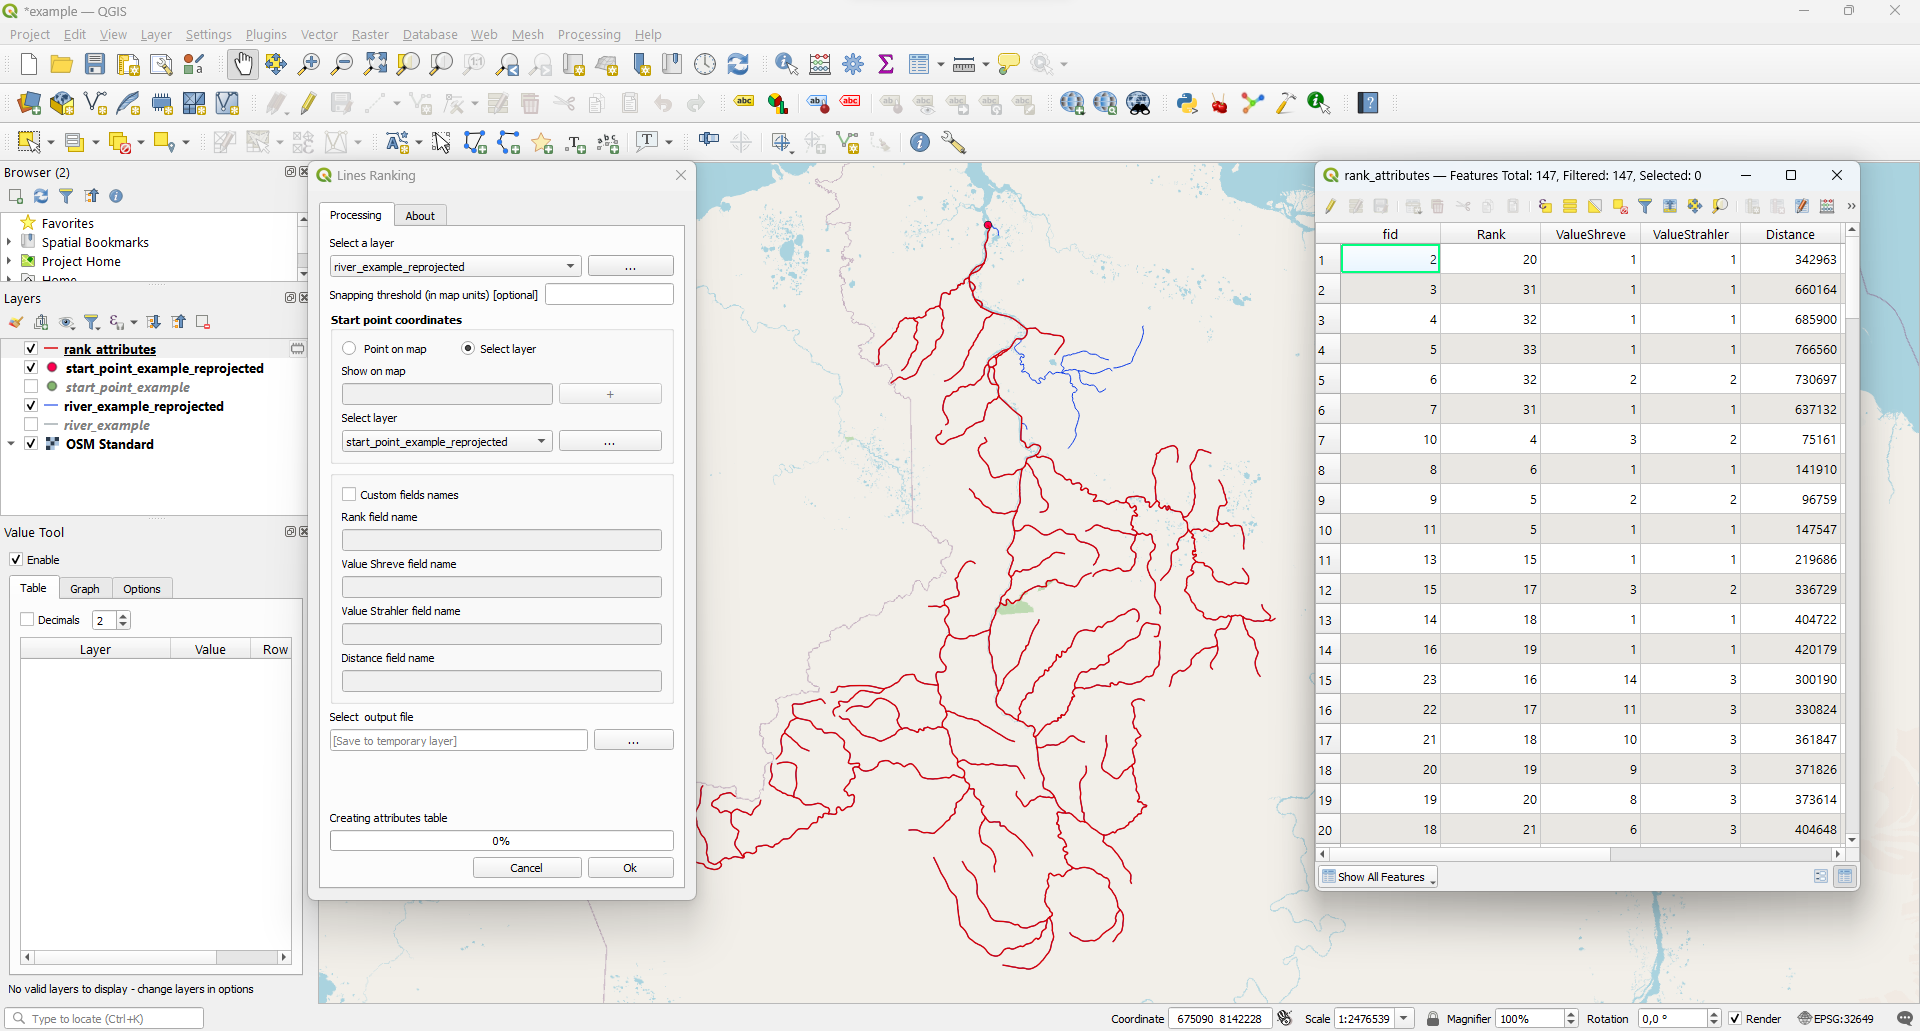
Usage example (Select layer)
You can also use a one-point vector layer to assign the starting point run the algorithm.
We can use start_point_example. Re-project this point layer: Processing - Toolbox -
Reproject layer - assign "WGS 84 / UTM zone 49N". Save result into file start_point_example_reprojected.
Results overview
The plugin creates a new vector layer (default name rank_attributes) in which the following fields (in attributes table) appear:
- ValueShreve - total number of tributaries. You can consider this value as "Shreve stream order".
- ValueStrahler - Strahler order.
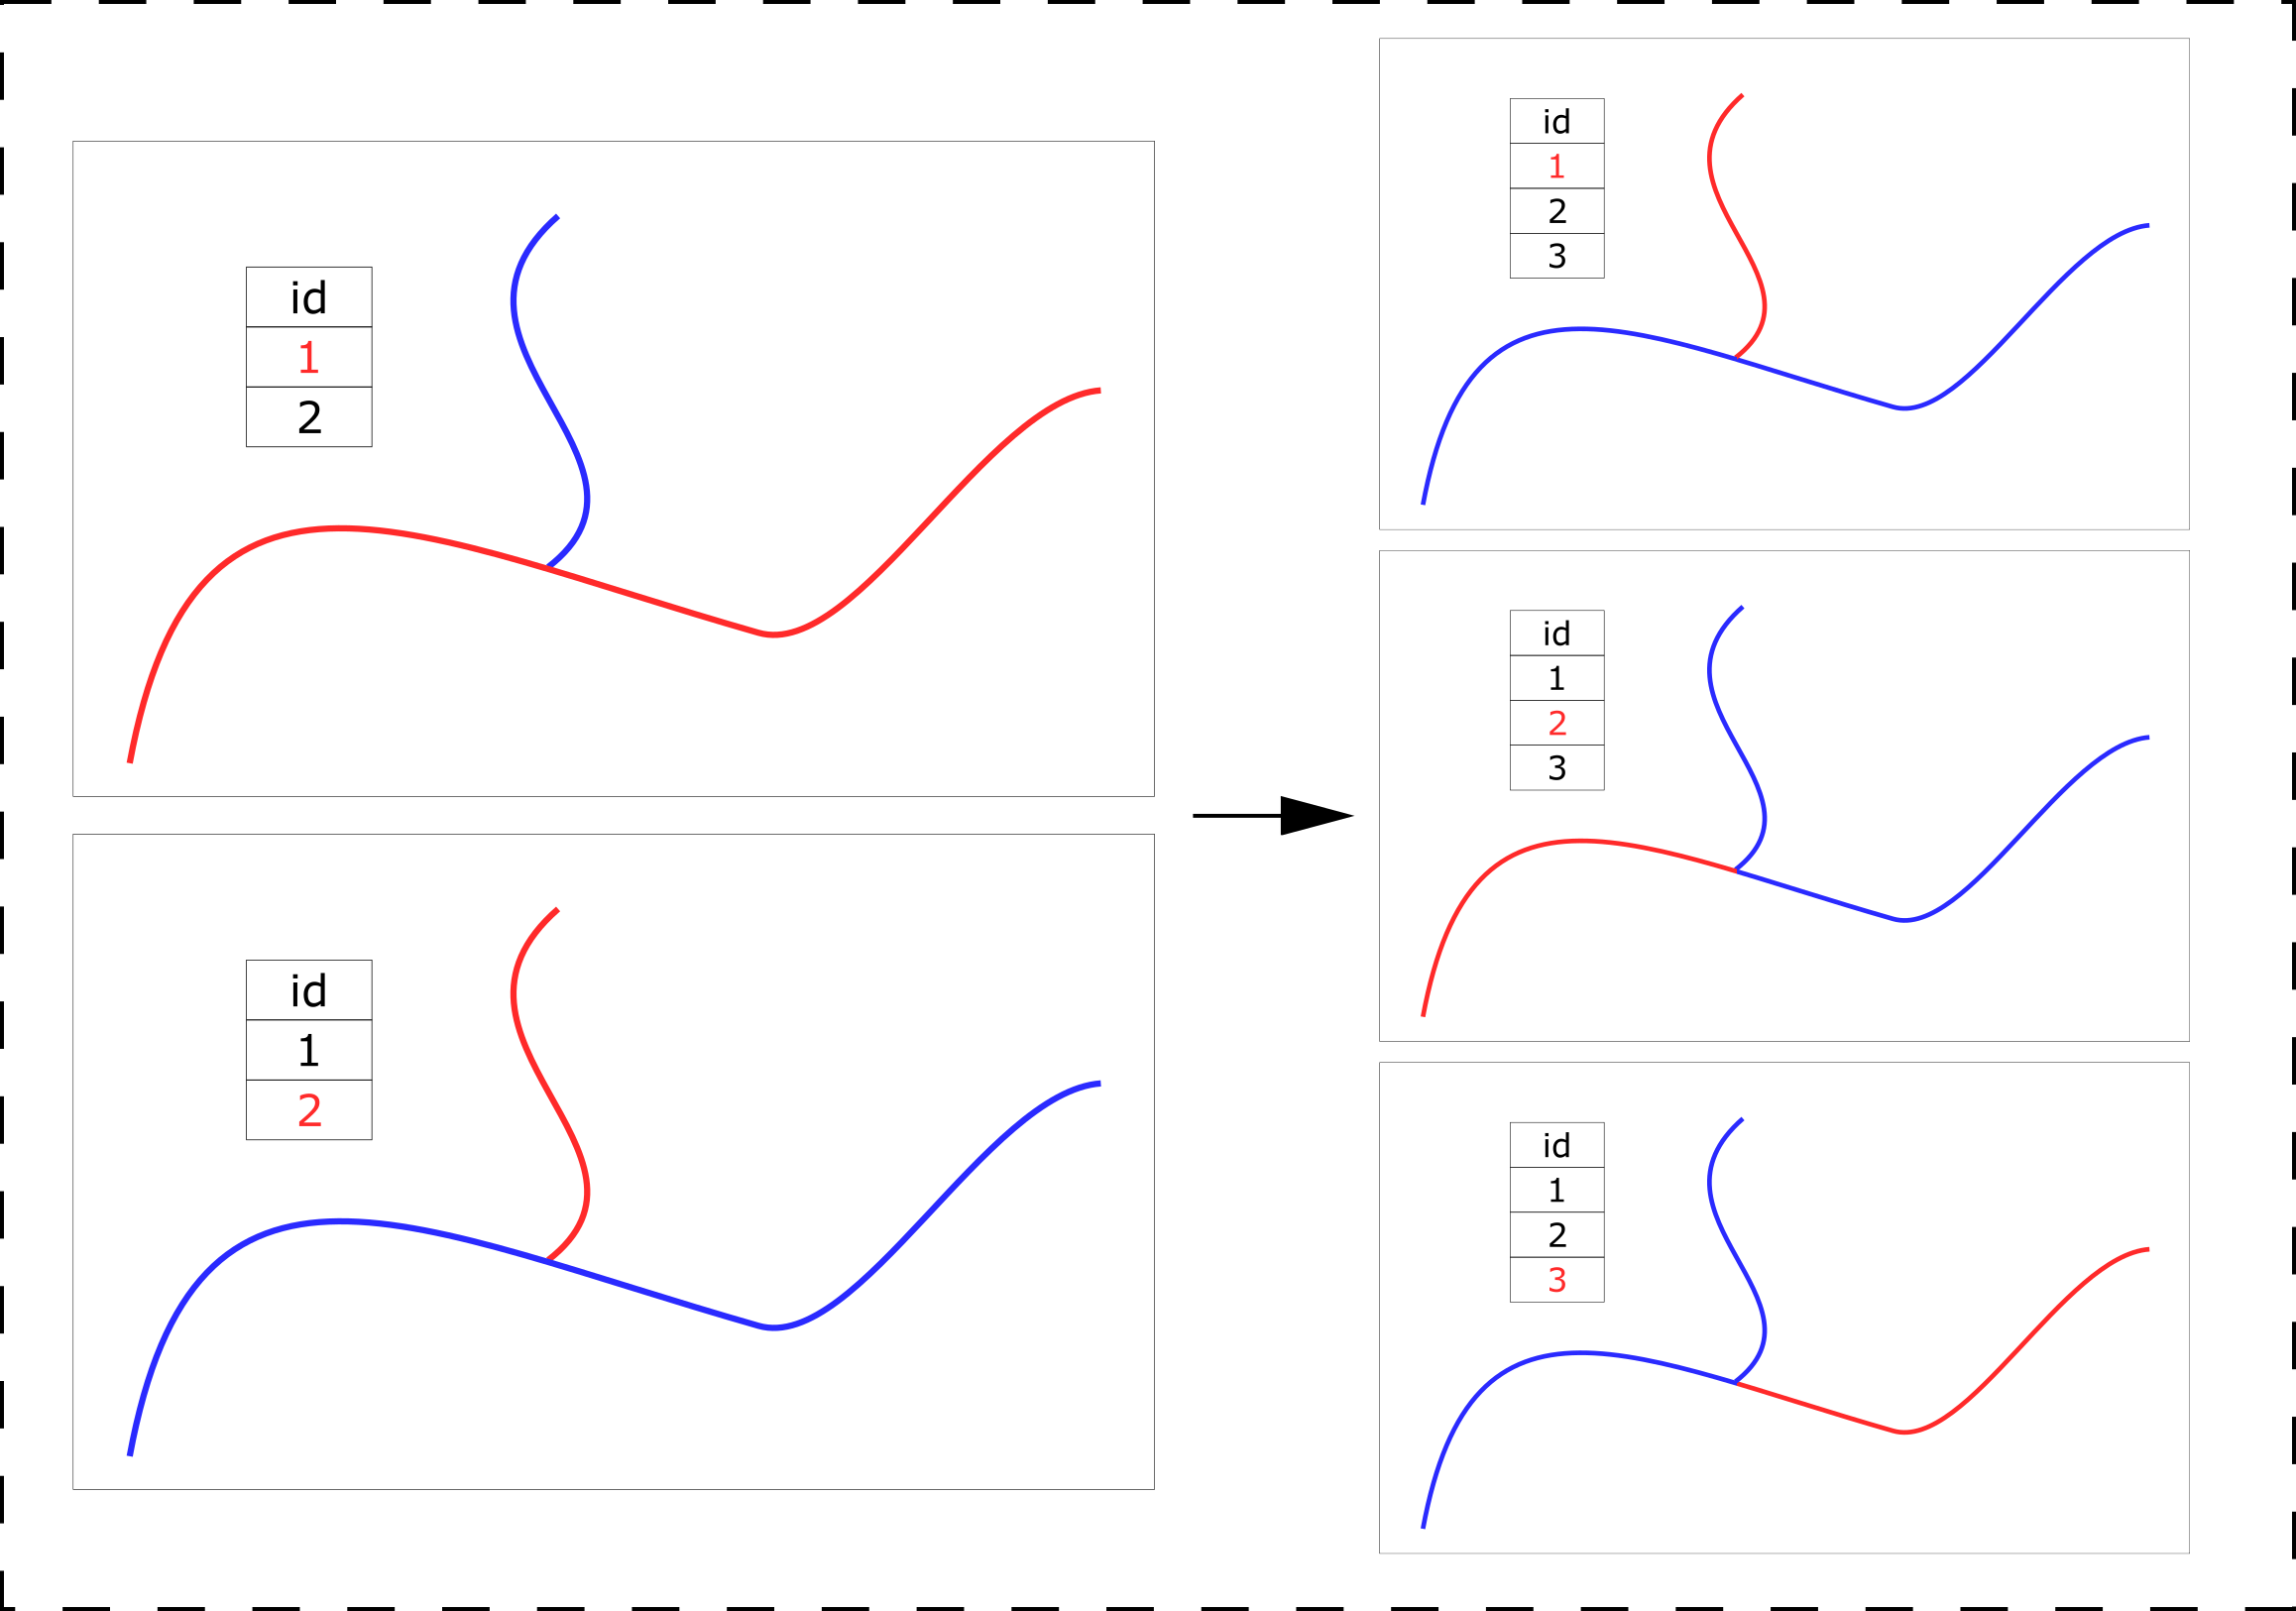
- Rank - distance to the segment from the starting point in a categorized form: rank 1 means that this segment is adjacent to the starting point. rank 2 are those adjacent to segments with rank 1, etc. This coefficient can be considered the inverse of the "Topological order"
- Distance - distance to the segment from the starting point (in map units)
All four new fields can be seen in the attribute table: rank_attributes - Open Attribute Table.
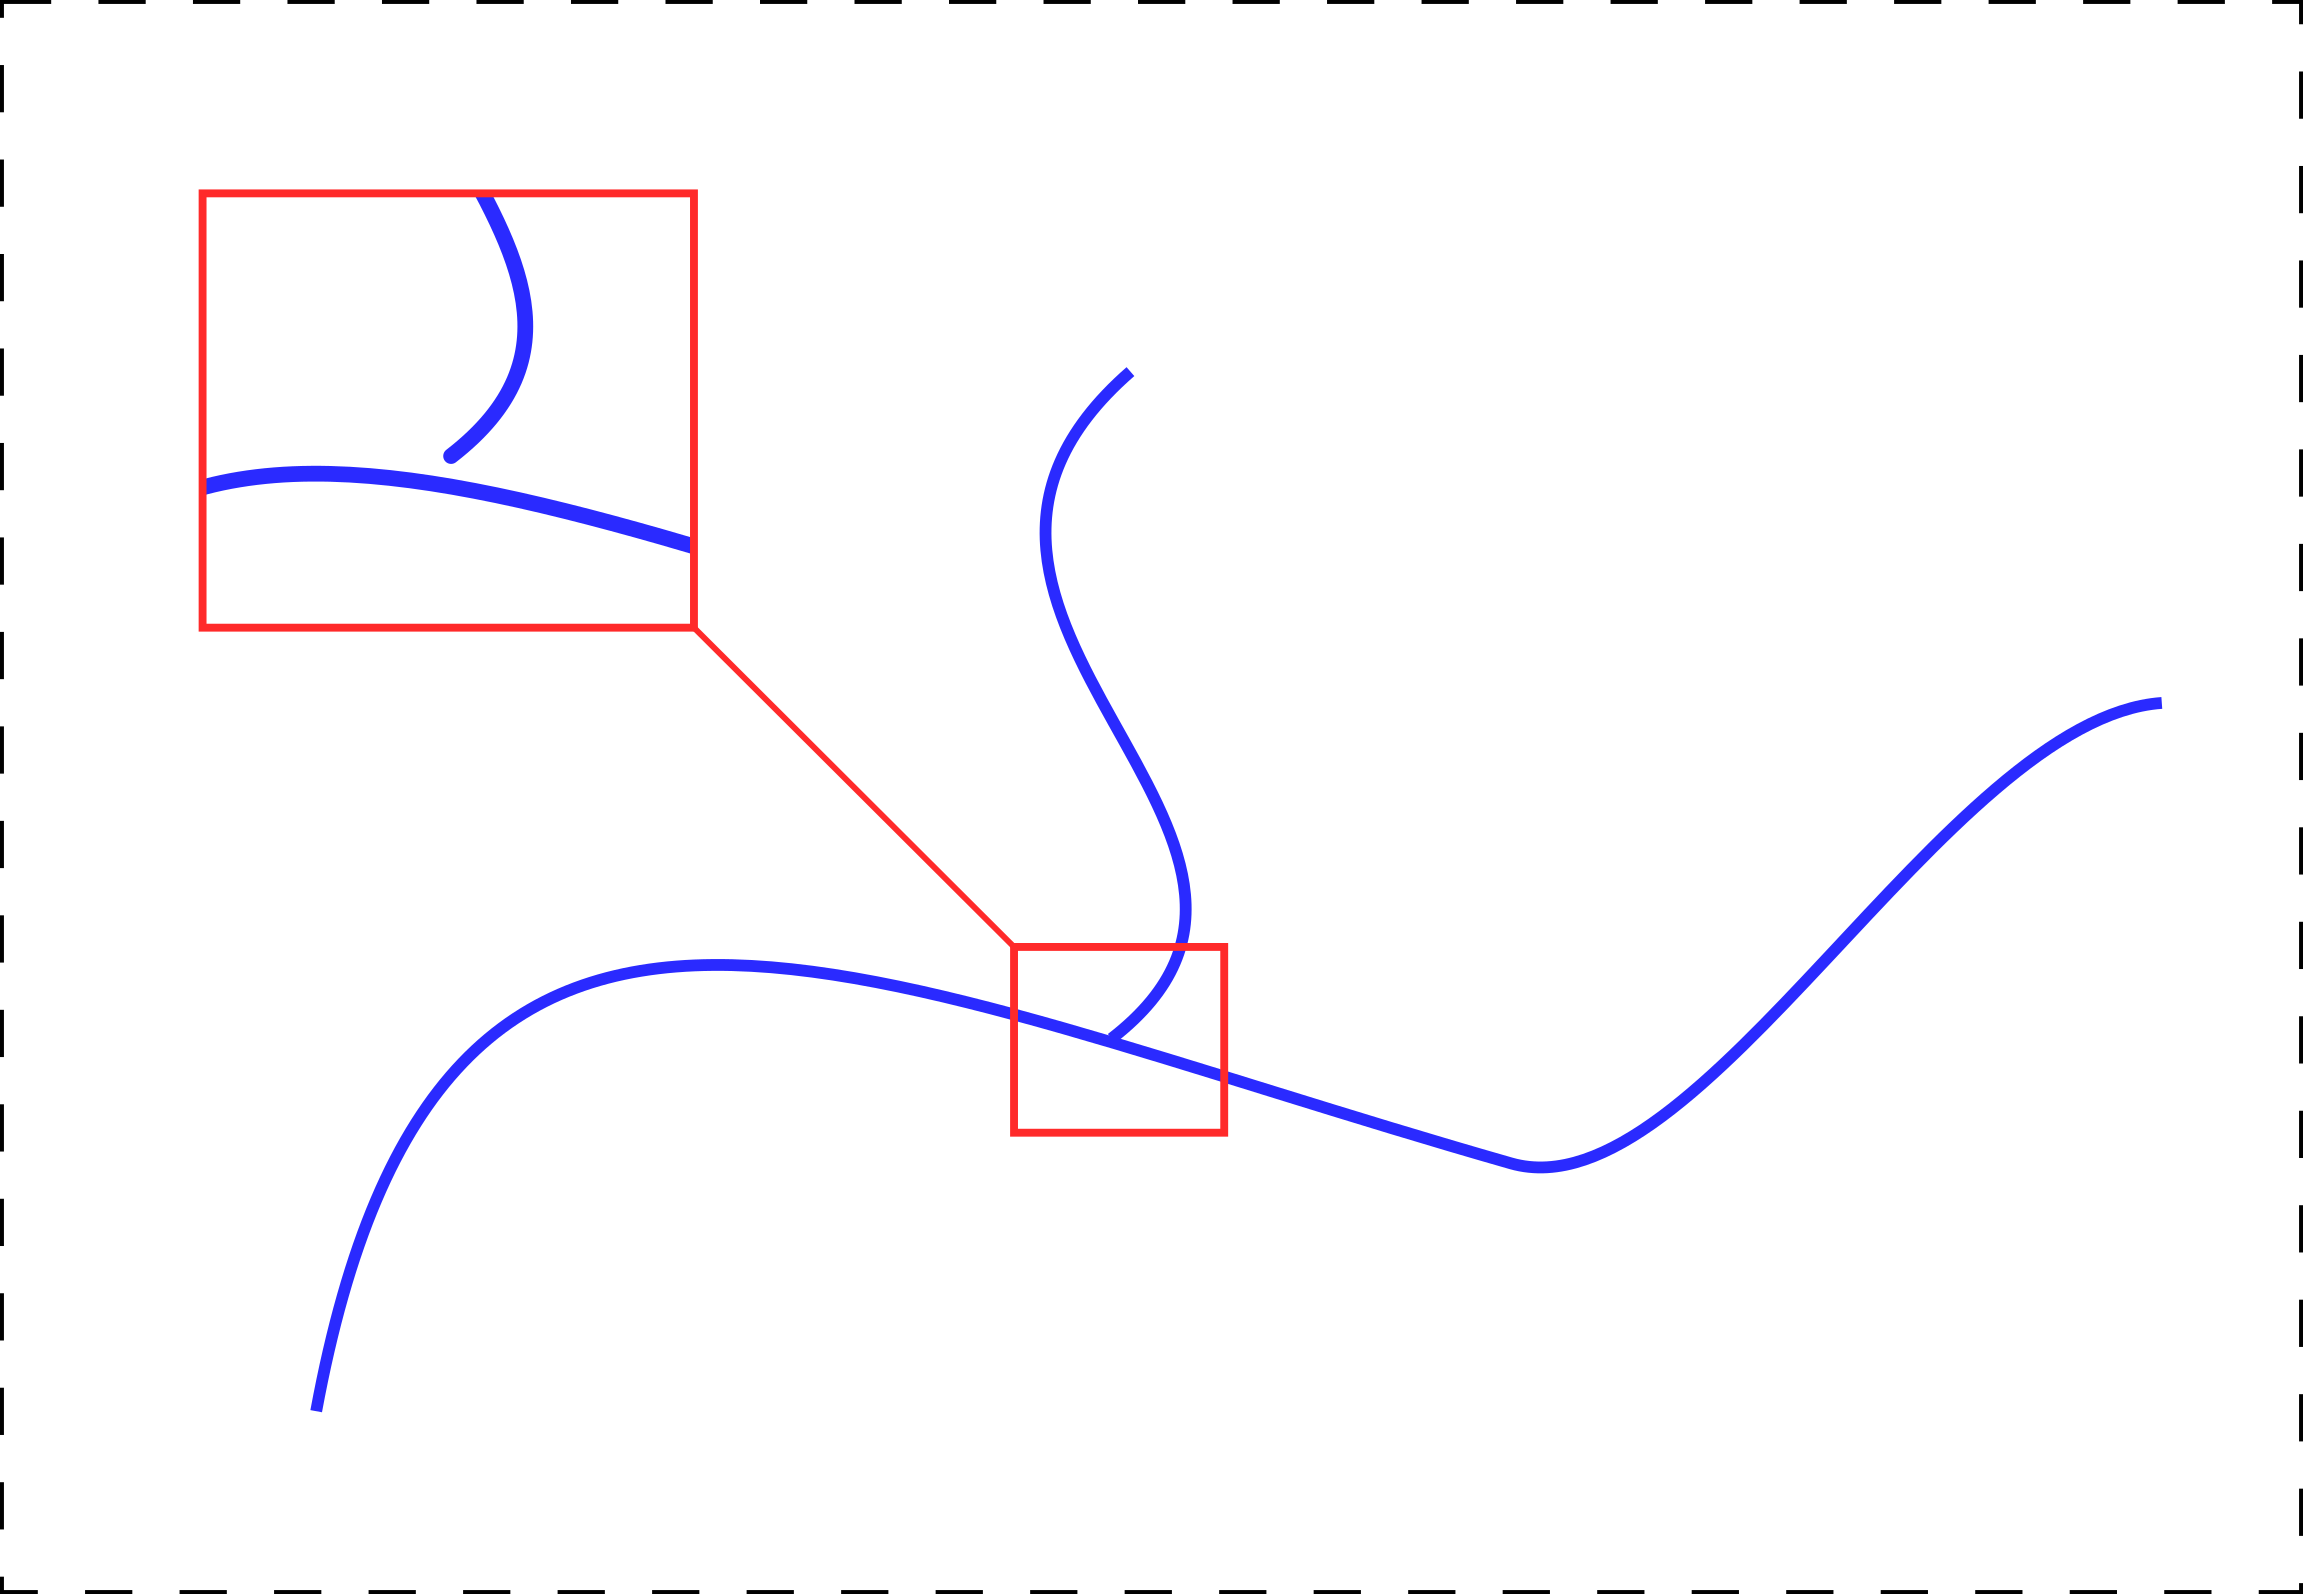
We can also see that our layer is smaller than the original layer - some parts of the river have gone off. For example, check this picture:

This is ok - the topology of vector layers may contain errors, so some elements of the vector layer do not fit tightly together:
To fix this, pay attention to the algorithm parameter Snapping threshold (in map units). We can set the number to 25 meters, for example, and then all layer gaps that do not exceed 25 meters will be combined:

You may also notice that the structure of the vector layer has changed. For example, instead of large vector layer elements, several small ones have appeared. This is also normal! The plugin splits the source layer into segments, so the result is presented as a segmented layer.
Visualization
To better understand what values have been assigned to this layer, we suggest preparing some visualizations.
ValueShreve
Shreve order
rank_attributes - Properties - Symbology - Graduated. Then choose ValueShreve field for Value
and 'Size' for Method and click Classify:
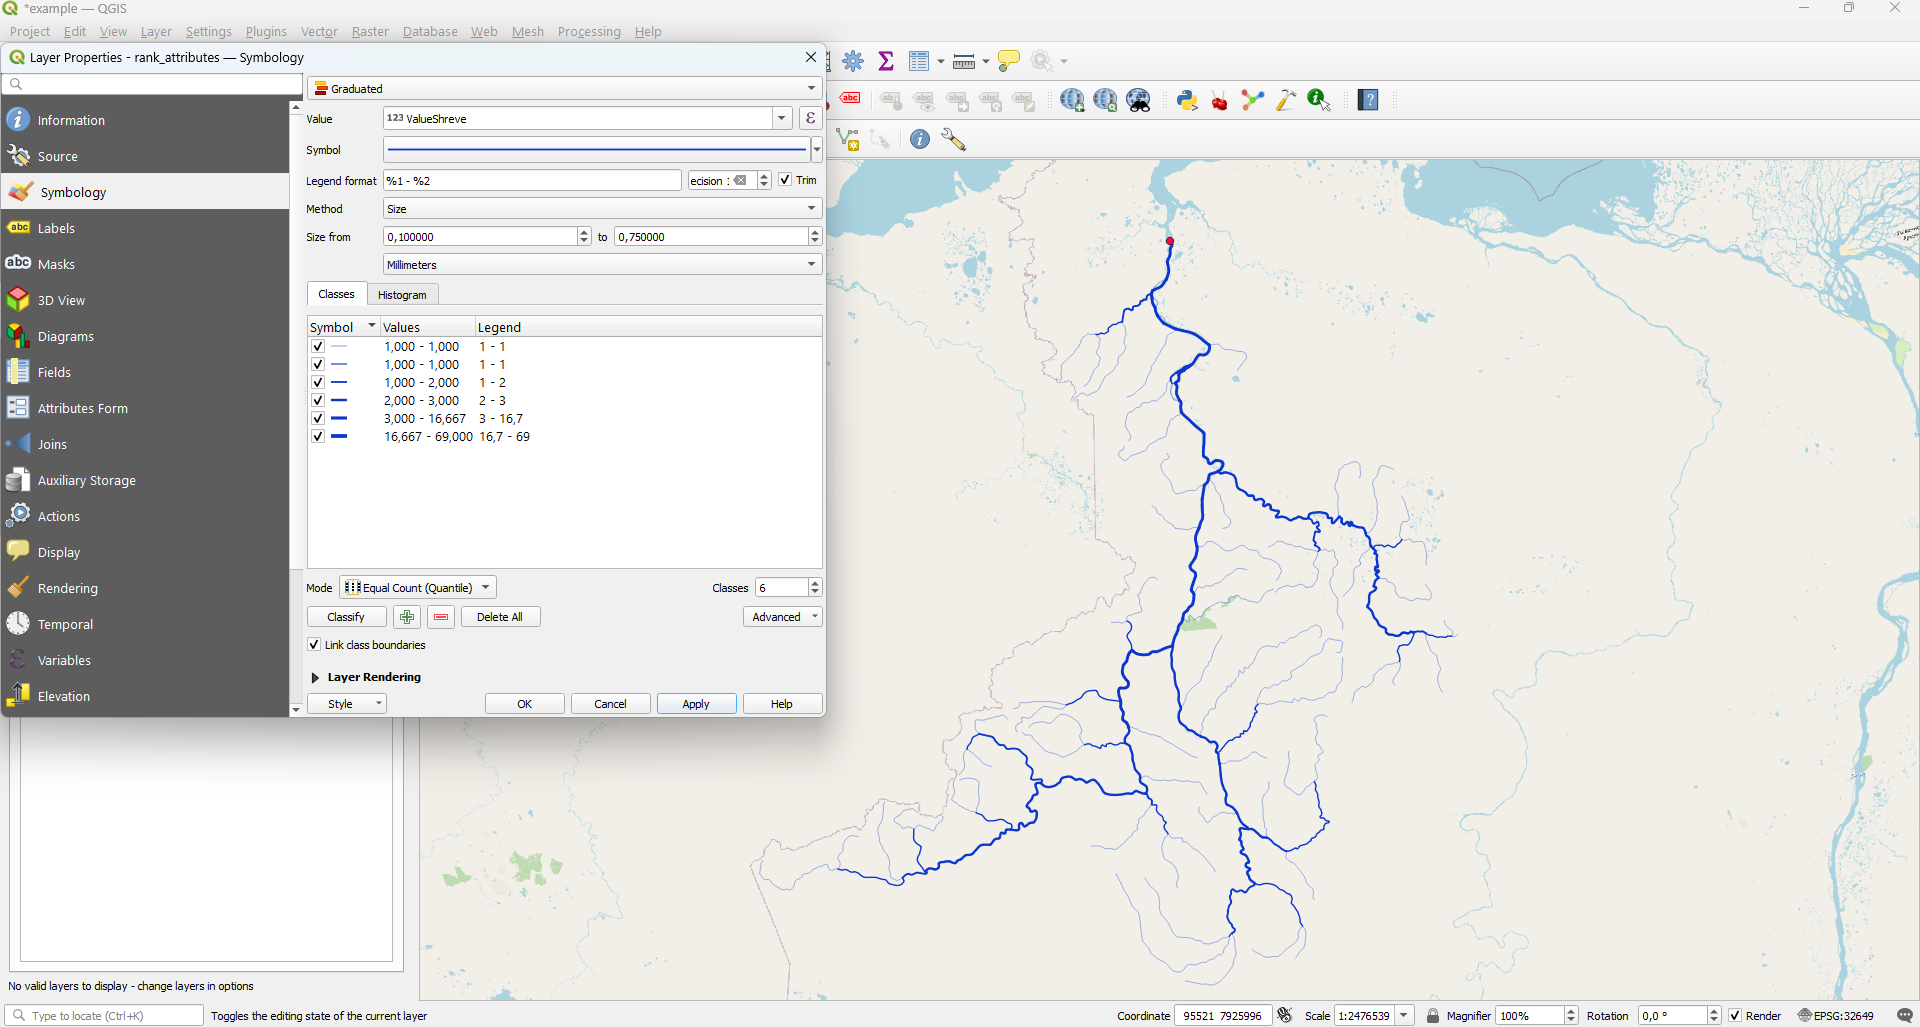
Thus, using the Value attribute you can show the total number of tributaries.
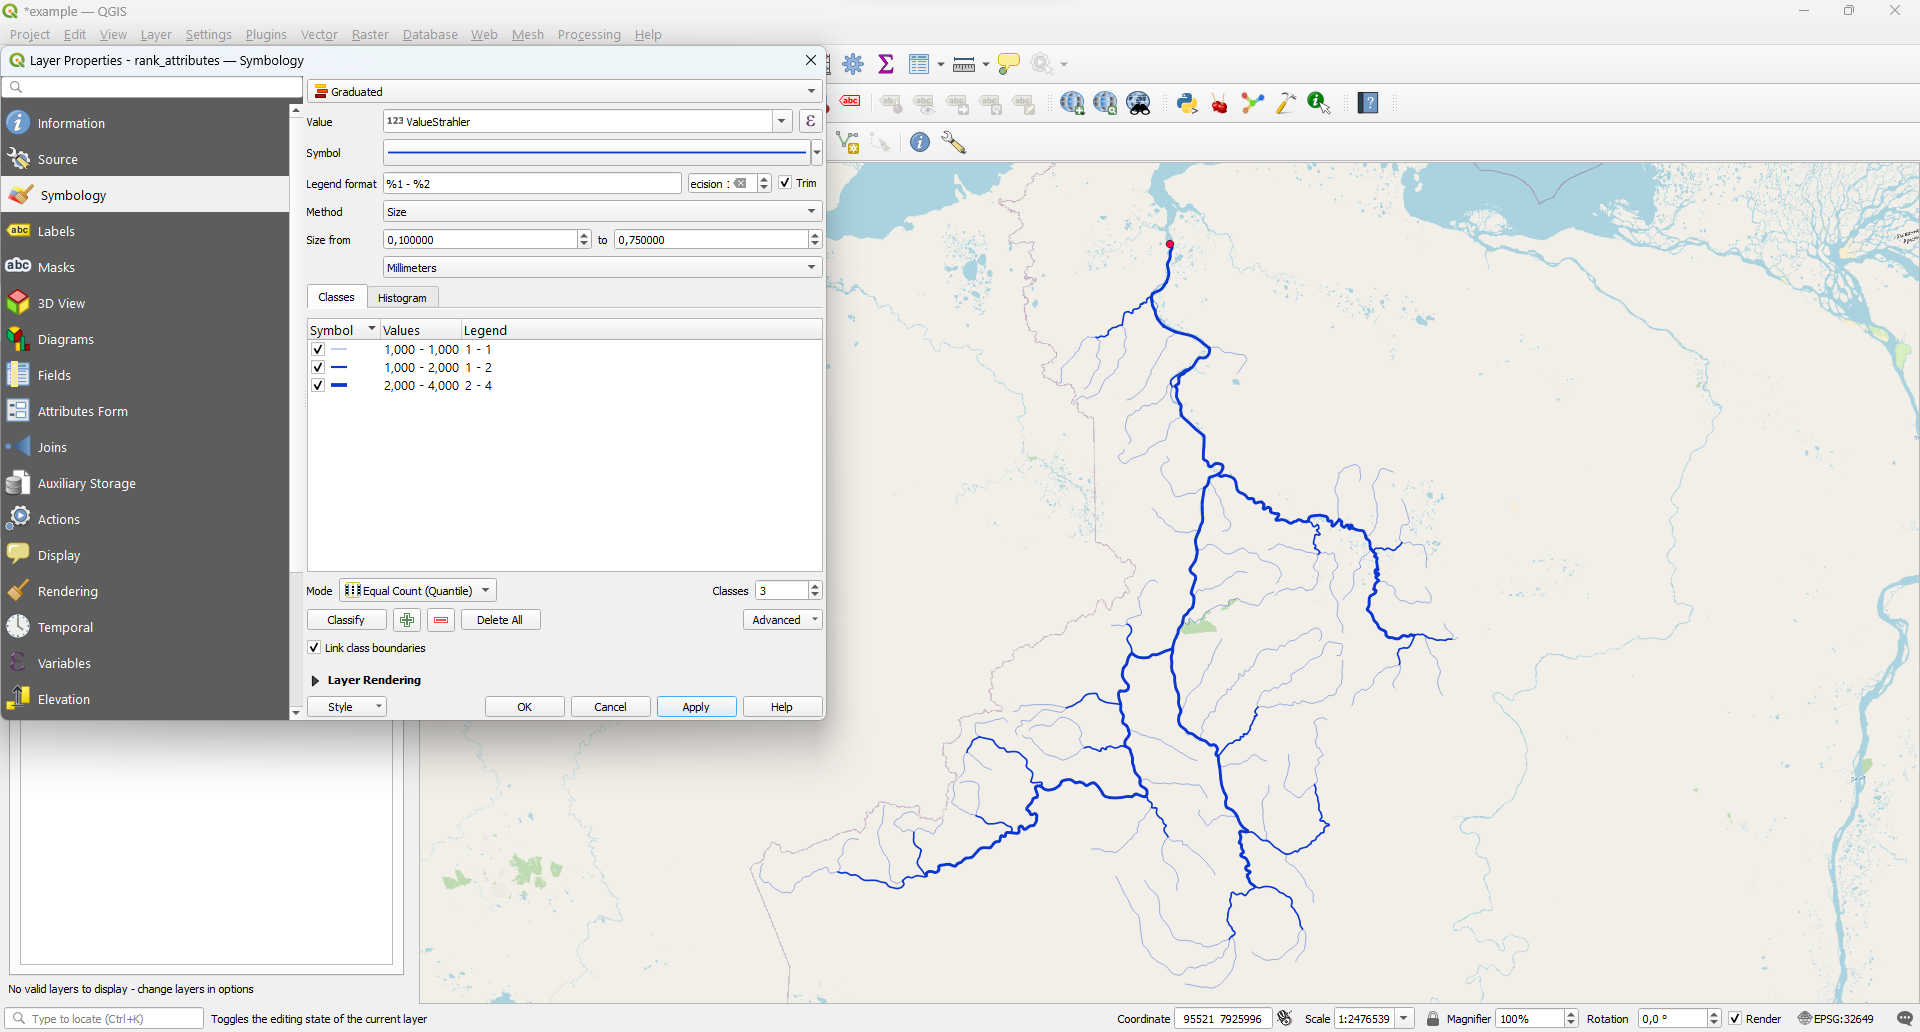
ValueStrahler
Strahler order
rank_attributes - Properties - Symbology - Graduated. Then choose 'ValueStrahler' field for Value
and 'Color' for Method and click Classify:
Rank
Topological order
rank_attributes - Properties - Symbology - Graduated. Then choose 'Rank' field for Value
and 'Color' for Method and click Classify:
![]()
With the help of assigned ranks you can determine how far the river section (segment) is located from the estuary - in terms of the remoteness of the graph nodes.
Distance
The Rank attribute gives an incomplete idea of the remoteness of the segments. Therefore, if you are interested in distance in meters, use the "Distance" attribute to visualize.
rank_attributes - Properties - Symbology - Graduated. Then choose 'Distance' field for Value
and 'Color' for Method and click Classify:
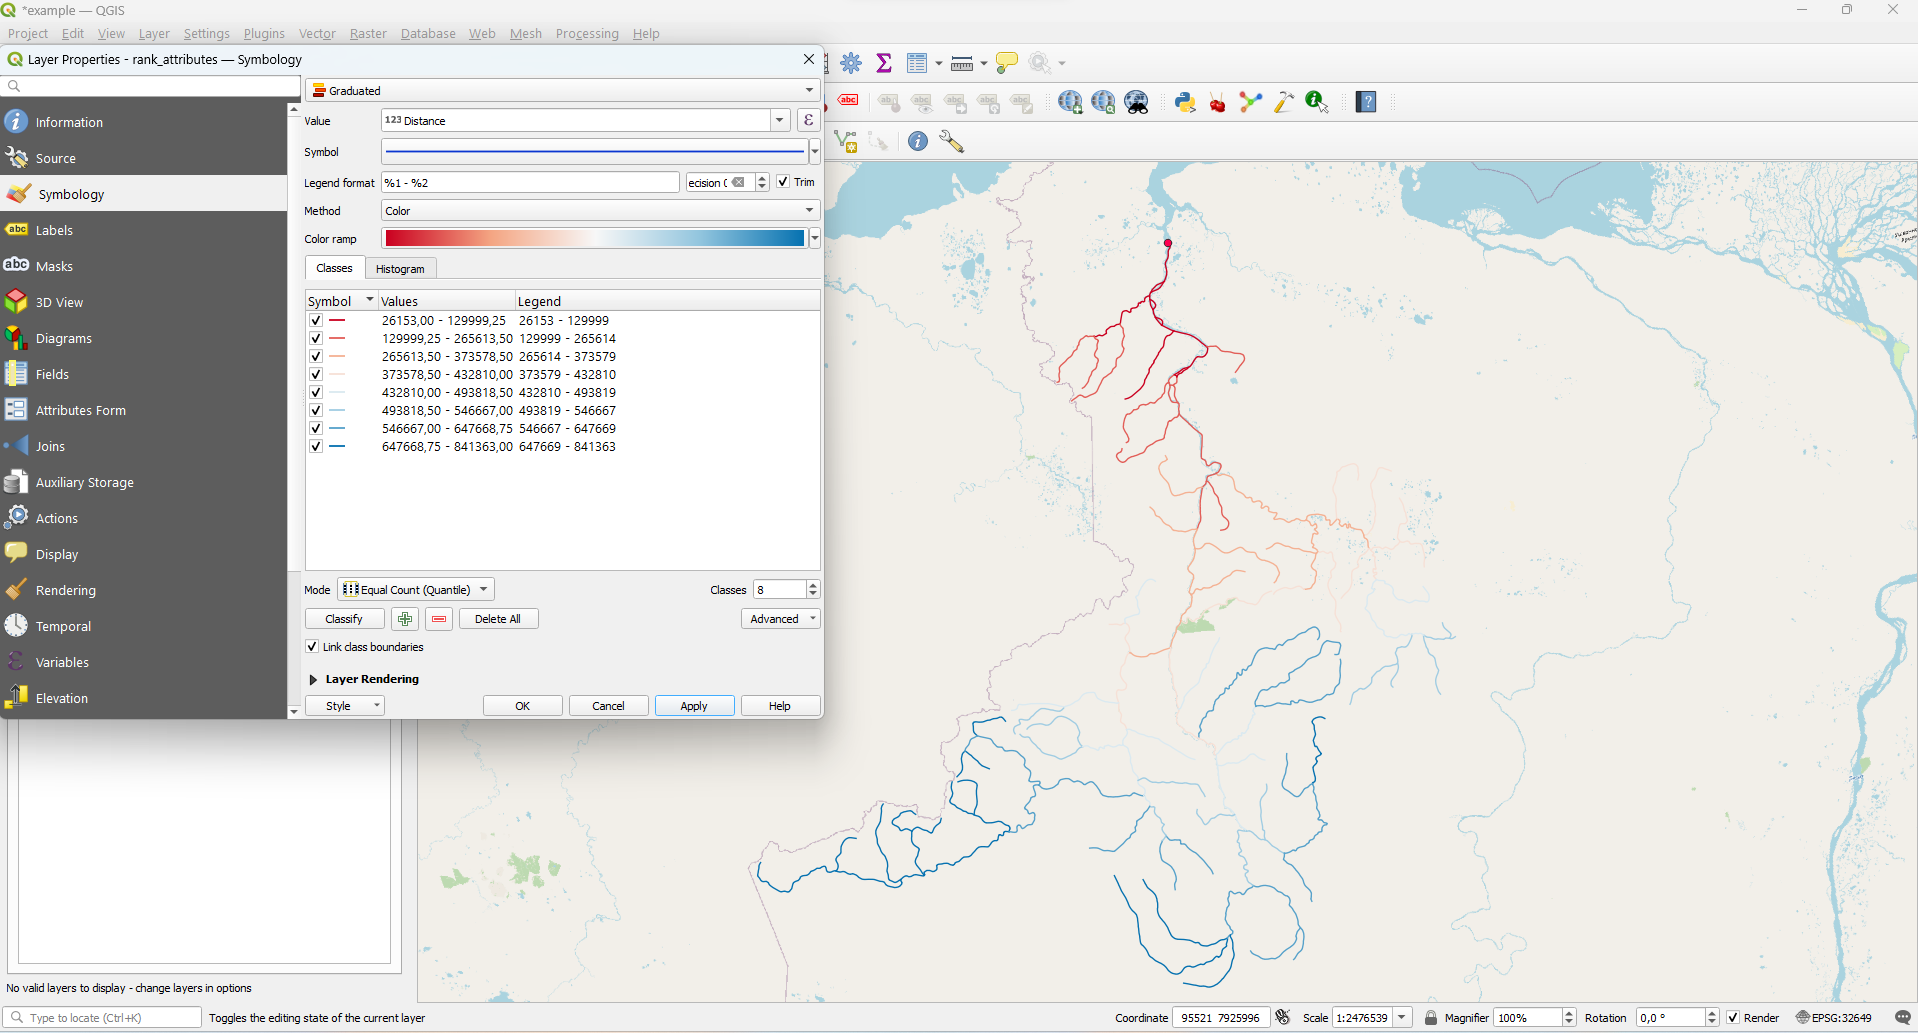
With the help of assigned ranks you can determine how far the river section (segment) is located from the estuary - in terms of the actual distance metrics.